2024 S&P 500 and TSX 60 CEO compensation comparison
This report compares market trends for 2024 and 2023 in the S&P 500 and TSX 60, including:
- CEO target compensation
- CEO actual STI payouts
- CEO LTI vehicles
- Company Say-on-Pay (SoP) results
Methodology
For the S&P 500 and TSX 60 CEO compensation, years in the analysis represent the following fiscal year end dates:
| Year | Fiscal year ends |
|---|---|
| 2024 | June 1, 2023 – May 31, 2024 |
| 2023 | June 1, 2022 – May 31, 2023 |
- Say-on-Pay result years reflect company meeting dates within a given calendar year. 2024 reflects company meeting dates through 27 June 2024.
2024 data mainly reflects 2023 pay and 2023 mainly reflects 2022 pay.
- Target Total Direct Compensation (Target TDC) = Base Salary + Target Short-Term Incentives (Target STI) + Target Long-Term Incentives Grant Value (Target LTI).
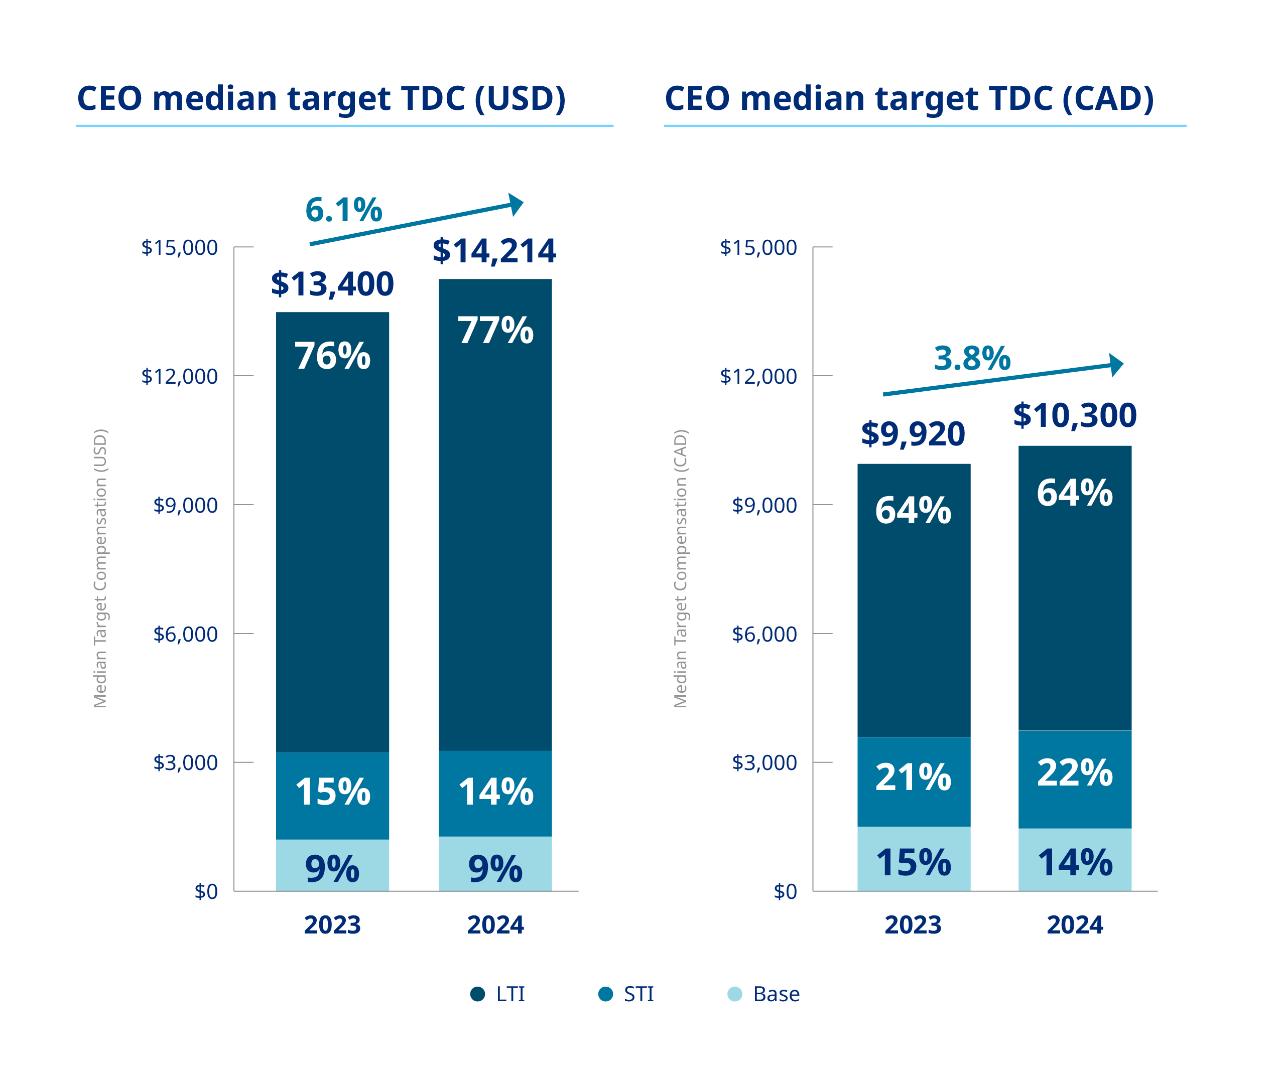
CEO target compensation
S&P 500 LTI accounts for a greater portion of target TDC than in the TSX 60 — about three-quarters versus two-thirds.
US S&P 500
CEO median target TDC increased 6.1% in 2024, driven mostly by a 7.6% increase in target LTI grant values.
Canada TSX 60
CEO median target TDC increased 3.8% in 2024 — target STI values increased by 5.2% and target LTI grant values increased by 4.1%
CEO actual STI payouts
US S&P 500
CEO median actual STI payouts (114% of target) stayed relatively similar YoY — the percent of companies paying above target also remained relatively steady at 63%
Canada TSX 60
CEO median actual STI payouts (105% of target) decreased YoY although they remain above target — the percent of companies paying above target decreased significantly to 57%

CEO LTI vehicles
US S&P 500 and Canada TSX 60
CEO target LTI vehicle mix remains consistent YoY — PSUs are the most prevalent and heavily weighted vehicle; however, the S&P 500 favors RSUs as a second vehicle while the TSX 60 favors options.