Chasing liability growth rates

Higher interest rates have caused an increase in liability growth rates due to higher interest cost.
Executive Summary
- Defined benefit (DB) pension plans face significant challenges as rising interest rates increase liability growth rates, complicating investment policy design.
- Plan sponsors may need to consider strategies such as increasing allocations to higher returning assets or adjusting the balance between return-seeking and liability hedging investments to navigate the current environment.
- Key metrics such as Surplus Volatility and Surplus Return are essential for assessing the risk-return trade-offs of investment options.
- A thorough evaluation of the impact of higher interest rates and declining equity risk premiums on cash funding, funded status, and pension expenses is crucial for aligning strategies with sponsor objectives and improving outcomes.
Background
Figure 1. Year-end Discount Rates
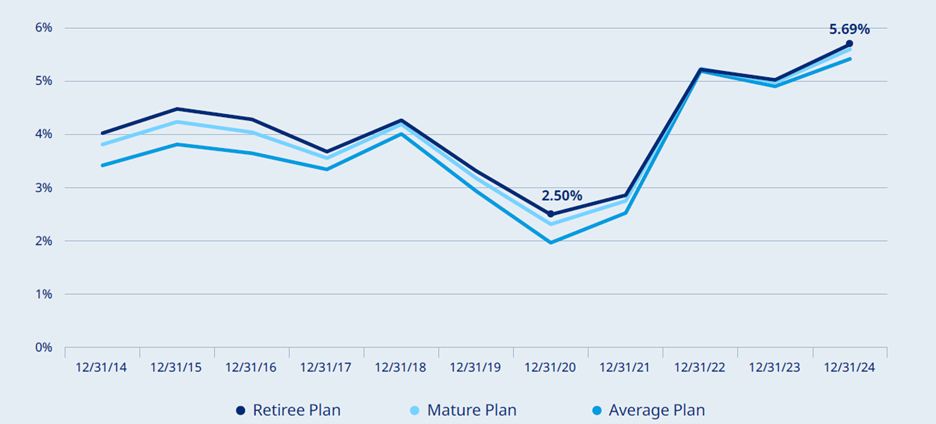
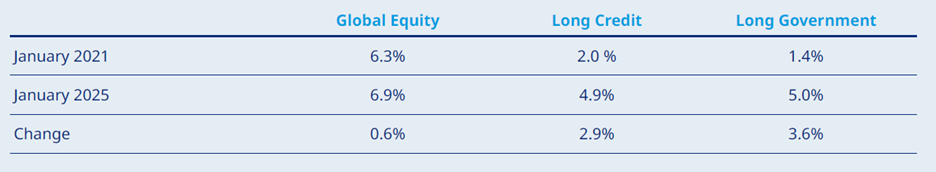
Figure 2. Capital Market Assumptions
Evaluating investment policy options
We typically utilize two key metrics to assess the risk-return trade-offs of investment policy options: Surplus Volatility and Surplus Return. Surplus Volatility measures the potential change in a plan’s surplus or deficit due to fluctuations in market conditions, primarily equity returns, interest rates, and credit spreads. It reflects how these factors impact both the asset portfolio and the liability values. Surplus Return is the expected asset return in excess of the liability growth rate, depending on the asset portfolio return expectations, the current funded status, and the expected liability growth rate. We can also evaluate the efficiency of alternative portfolios by comparing the Pension Sharpe Ratio, defined as the ratio of the Surplus Return over the Surplus Volatility. A higher ratio indicates a portfolio is generating more excess return per unit of funded status risk.
Below is an example of what these metrics might look like for a typical closed pension plan using return expectations as of January 1, 2025.
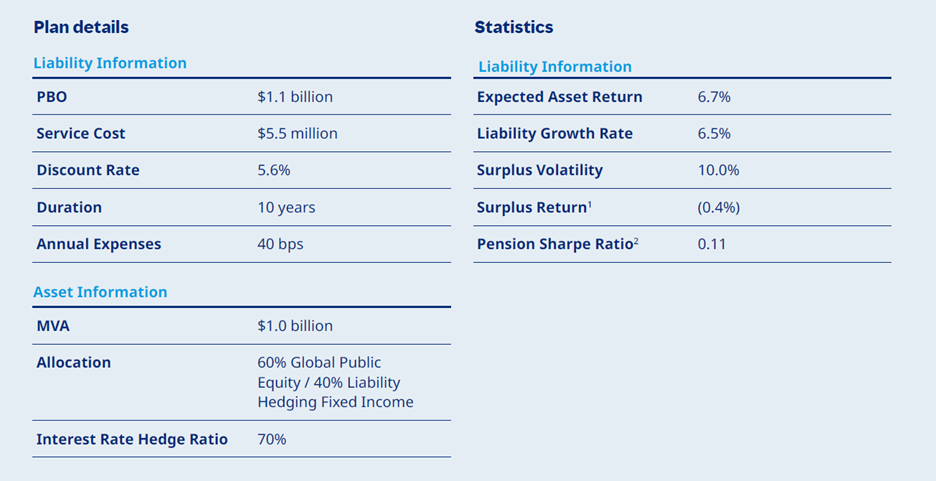
As you can see in the table above, the 60% return-seeking / 40% liability hedging allocation generates a negative Surplus Return, leaving the sponsor to make up the difference with funding if the expected returns are realized. While the results will vary depending on plan specifics, the liability growth rates associated with the current market environment make it challenging to generate sufficient returns to improve or, in some cases, even maintain the funded status level. For underfunded plans or plans with more significant ongoing accruals, the challenge is even greater.
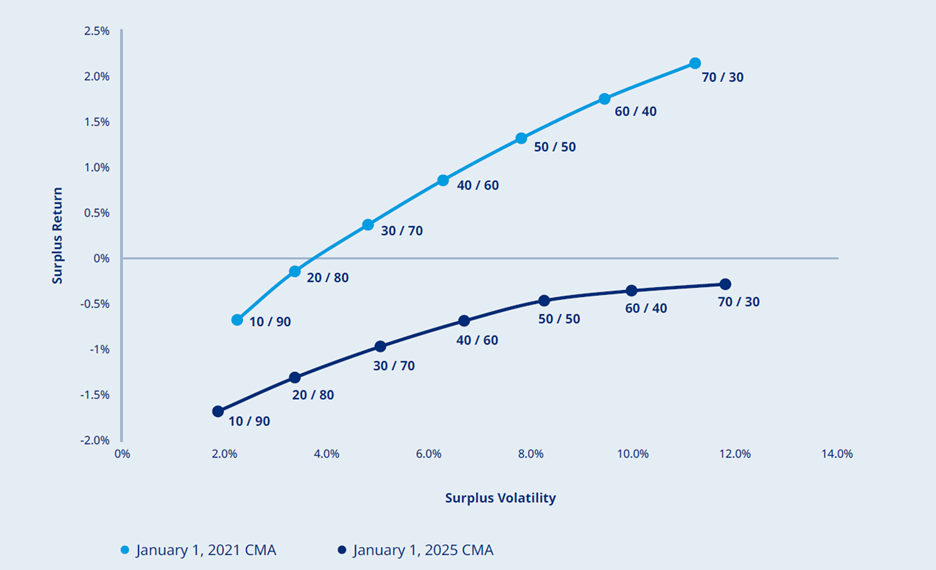
One potential strategy for improving outcomes is to increase the allocation to equity. The chart below (Figure 3) compares the trade-off between Surplus Return and Surplus Volatility using an efficient frontier based on Mercer’s Capital Market Assumptions (CMA) as of January 2021 and as of January 2025. As illustrated, while still producing higher Surplus Return outcomes, the potential benefits of increasing the equity allocation have diminished, and the efficient frontier is considerably flatter due to current market conditions. In fact, in the current environment, even the more aggressive allocations do not result in positive excess returns for the sample plan modeled.
Figure 3. Efficient frontiers as of January 2021 and January 2025 at various asset allocations for an illustrative plan
Next steps
What actions can be taken to improve this situation? There are no straightforward answers. For some plan sponsors, allocating to higher returning assets, including high tracking error managers, or looking at ways to harness the illiquidity premium may enhance return expectations, but not all can accommodate the associated illiquidity and governance considerations. Others may need to consider increasing the allocation to return-seeking assets, even if the trade-off is not as favorable as it once was. There are also plan sponsors who are willing to take leverage within their return-seeking assets, and as a result utilize “portable alpha” strategies on top of equity allocations.
Regardless of where a plan sponsor’s risk appetite lies, we believe that evaluating the impact of higher interest rates and the declining equity risk premium on key outcomes—such as cash funding, funded status levels, and projected pension expense—is a valuable starting point. Understanding the implications and exploring all available options, including additional funding, can lead to better alignment with objectives and risk tolerances.