S&P 1500 Pension Funded Status Increased by 2 Percent in 2023, according to Mercer
United States, New York
The estimated aggregate funding level of pension plans sponsored by S&P 1500 companies as of December 31, 2023, increased to 107 percent from 105 percent as of December 31, 2022. Over the course of 2023, double-digit gains in equity markets were partially offset by an approximately 25 basis point decrease in interest rates used to calculate corporate pension plan liabilities. The estimated aggregate surplus of $118 billion as of December 31, 2023, is $41 billion greater than the $77 billion surplus at the end of 2022 according to Mercer,1 a global consulting leader and a business of Marsh McLennan (NYSE: MMC).
Mercer’s main findings for 2023 include:
- Funded status improved steadily through the first 3 quarters of the year, soaring to as high as 113% in October before subsequently fading to the end of the year.
- The deficit of $77 billion at 2022 year-end changed to a surplus of $118 billion at 2023 year-end.
- The number of plan sponsors over 100% funded increased from 48% at year-end 2022 to 58% at the end of 2023.
The S&P 500 index increased 24.2 percent during 2023 and the MSCI EAFE index increased 15.0 percent. Typical discount rates for pension plans as measured by the Mercer Yield Curve decreased from 5.24 percent to 4.99 percent during 2023.
“Funded status fell three percent in December but was up two percent year over year,” said Scott Jarboe, a Partner in Mercer’s Wealth Practice. “In 2023, we saw corporate interest rates rise exceeding 6% in October before settling in closer to 5% by the end of the year. Equity markets were near all-time highs to finish 2023 as inflation cooled in the second half of the year and the Fed chose not to raise rates after July. During October, pension funded status skyrocketed to 113%, and risk transfer activity continued its surge over the course of the year with many plan sponsors taking advantage of historically high funded levels. Going into 2024, there is still an opportunity for many plan sponsors to capitalize on de-risking opportunities. Whether the goal is to shrink, hibernate, or terminate the plan, the risk transfer environment continues to be strong. However, the market can change rapidly as evidenced by the 3% drop in funded status we saw in December.”
Mercer estimates the aggregate funded status position of plans sponsored by S&P 1500 companies on a monthly basis. Figure 1 (below) shows the estimated aggregate surplus/(deficit) position and the funded status of all plans sponsored by companies in the S&P 1500. The estimates are based on each company’s latest available year-end statement2 and by projections to December 31, 2023, in line with financial indices. The estimates include U.S. domestic qualified and non-qualified plans, along with all non-domestic plans. The estimated aggregate value of pension plan assets of the S&P 1500 companies as of December 31, 2022, was $1.73 trillion USD, compared with estimated aggregate liabilities of $1.65 trillion USD. Allowing for changes in financial markets through December 31, 2023, changes to the S&P 1500 constituents, and newly released financial disclosures, at the end of December the estimated aggregate assets were $1.83 trillion USD, compared with the estimated aggregate liabilities of $1.71 trillion USD. Figure 2 shows the discount rates used in Mercer’s pension funding calculation.
Notes for editors
Information on the Mercer Yield Curve is available at http://www.mercer.com/pensiondiscount.
The Mercer US Pension Buyout Index may be accessed at http://www.mercer.us/our-thinking/mercer-us-pension-buyout-index.html.
Unless otherwise stated, the calculations are based on the Financial Accounting Standard (FAS) funding position and include analysis of the S&P 1500 companies.
Figure 1 : Estimated aggregate funded status of all plans sponsored by companies in the S&P 1500
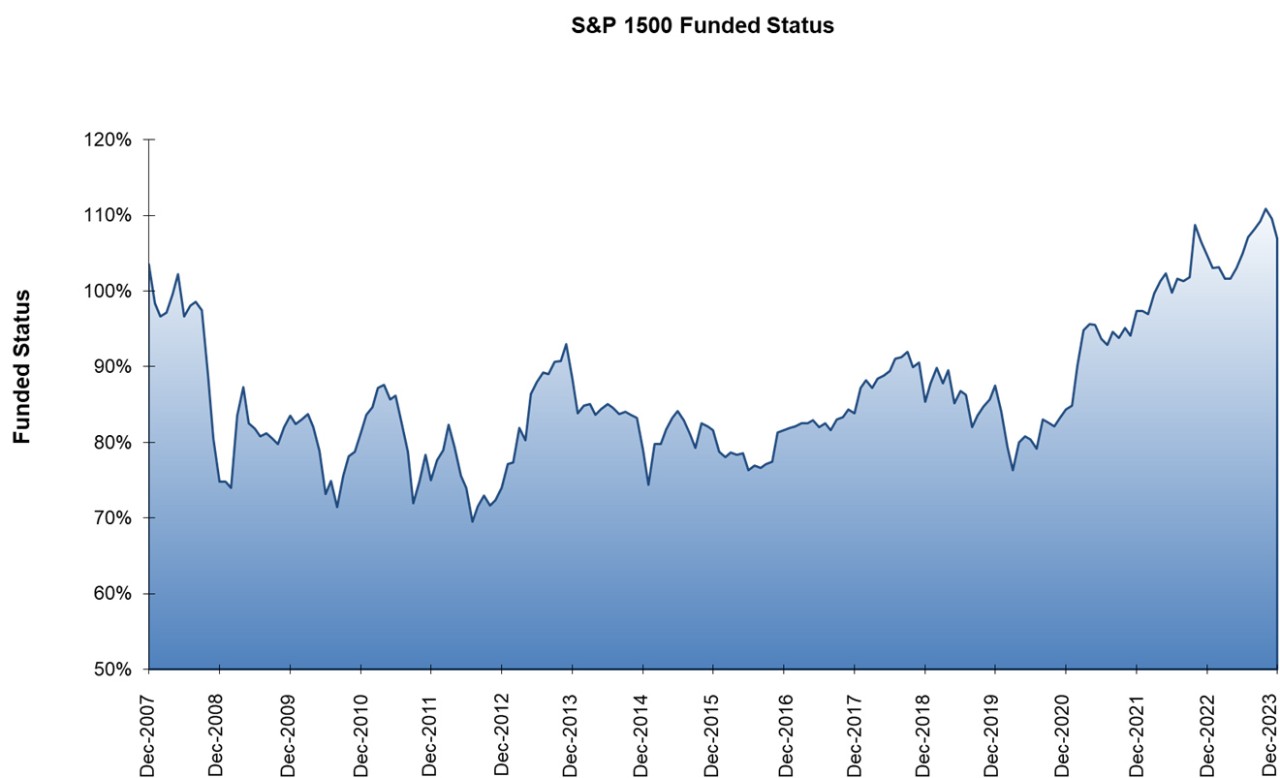
Source: Mercer, December 2023
Figure 2: High Quality Corporate Bond Yield and S&P 500 data points
About Mercer
1 Figures provided by Mercer Investments LLC.
2 Source of financial statement data: Standard & Poor’s Capital IQ. Standard and Poor’s is a division of The McGraw-Hill Companies, Inc. This may contain information obtained from third parties, including ratings from credit ratings agencies such as Standard & Poor’s. Reproduction and distribution of third party content in any form is prohibited except with the prior written permission of the related third party. Third party content providers do not guarantee the accuracy, completeness, timeliness or availability of any information, including ratings, and are not responsible for any errors or omissions (negligent or otherwise), regardless of the cause, or for the results obtained from the use of such content. THIRD PARTY CONTENT PROVIDERS GIVE NO EXPRESS OR IMPLIED WARRANTIES, INCLUDING, BUT NOT LIMITED TO, ANY WARRANTIES OF MERCHANTABILITY OR FITNESS FOR A PARTICULAR PURPOSE OR USE. THIRD PARTY CONTENT PROVIDERS shall not be liable for any direct, indirect, incidental, exemplary, compensatory, punitive, special or consequential damages, costs, expenses, legal fees, or losses (including lost income or profits and opportunity costs) in connection with any use of THEIR CONTENT, INCLUDING ratings. Credit ratings are statements of opinions and are not statements of fact or recommendations to purchase, hold, or sell securities. They do not address the suitability of securities or the suitability of securities for investment purposes, and should not be relied on as investment advice.