2025 Social Security, PBGC projected covered compensation figures


November 5, 2024
Social Security benefits payable will increase by 2.5% in 2025, the Social Security Administration (SSA) announced on Oct. 10 in updates that include the 2025 taxable wage base and the 2023 national average wage. The Pension Benefit Guaranty Corp. (PBGC) released its inflation-indexed 2025 premium amounts, maximum guaranteed benefit for single-employer pension plans and present value of the maximum guarantee. IRS has not yet issued 2025 covered compensation amounts, but Mercer has projected those figures using the published taxable wage base.
Social Security and Supplemental Security Income (SSI) amounts
Questions relevant to DC plan sponsors
| Social Security and SSI values | 2025 | 2024 | 2023 |
|---|---|---|---|
| Cost-of-living increase | 2.5% | 3.2% | 8.7% |
| Average annual wage (second preceding year) | $66,621.80 | $63,795.13 | $60,575.07 |
| OASDI contribution and benefit base (wage base) | 176,100 | 168,600 | 160,200 |
| “Old law” contribution and benefit base | 130,800 | 125,100 | 125,100 |
| Retirement earnings test exempt amount (annual) | |||
| Under full retirement age (full year) | $23,400 | $22,320 | $21,240 |
| Year individual attains full retirement age (period before attaining full retirement age) | 62,160 | 59,520 | 56,520 |
| Wages needed for a quarter of coverage | 1,810 | 1,730 | 1,640 |
| Disability thresholds (monthly amounts) | 1,620 | 1,550 | 1,470 |
| Substantial gainful activity — not blind | 2,700 | 2,590 | 2,460 |
| Substantial gainful activity — blind | 1,160 | 1,110 | 1,050 |
| Trial work period | |||
| Coverage thresholds for: | |||
| Domestic employees | 2,800 | 2,700 | 2,600 |
| Election workers | 2,400 | 2,300 | 2,200 |
Bend-points — primary insurance amount (PIA) formula applied to average |
|||
| 90% of AIME up to | 1,226 | 1,174 | 1,115 |
| 32% of AIME over first bend-point up to | 7,391 | 7,078 | 6,721 |
| 15% of AIME over second bend-point | |||
| Bend-points — maximum family benefit formula applied to worker’s PIA |
|||
| 150% of PIA up to | 1,567 | 1,500 | 1,425 |
| 272% of PIA over first bend-point up to | 2,262 | 2,166 | 2,056 |
| 134% of PIA over second bend-point up to | 2,950 | 2,825 | 2,682 |
| 175% of PIA over third bend-point | |||
| SSI federal payment standard (monthly amounts) | |||
| Individual | 967 | 943 | 914 |
| Couple | 1,450 | 1,415 | 1,371 |
| SSI student exclusion limits | |||
| Monthly limit | 2,350 | 2,290 | 2,220 |
| Annual limit | 9,460 | 9,230 | 8,950 |
PBGC premiums, guaranteed benefits and maximum present value
On Oct. 11, PBGC announced inflation-adjusted 2025 premium rates and the variable-rate premium cap. With the exception of the variable rate premium, all premium amounts — including the per-participant variable-rate premium cap — are indexed annually for wage inflation.
On Oct. 18, PBGC announced that the maximum guaranteed benefit at age 65 for terminating plans will rise to $89,181 in 2025 from $85,295 in 2024. This amount is determined using the Social Security “old law” contribution and benefit base (see Social Security and SSI amounts). The maximum guaranteed benefit is adjusted if benefit payments start before (or after) age 65 or are paid in a form other than a single-life annuity. Some of the guaranteed amount may be paid from the plan’s assets, and participants may receive more if the plan is better funded or if PBGC can recover other amounts from the plan sponsor.
| PBGC amount | 2025 | 2024 | 2023 |
|---|---|---|---|
| Flat-rate premium — single-employer plans | $106 | $101 | $96 |
| Flat-rate premium — multiemployer plans | 39 | 37 | 35 |
| Variable-rate premium per $1,000 of unfunded vested benefits* | 52 | 52 | 52 |
| Per-participant variable-rate premium cap | 717 | 686 | 652 |
| Annual maximum guaranteed benefit (payable as a single-life annuity starting at age 65) | 89,181 | 85,295 | 81,000 |
*Not indexed after 2023
On Nov. 4, PBGC published the 2025 present value of the maximum guarantee table. These values are used to administer Internal Revenue Code (IRC) Section 436 restrictions on lump sums and other accelerated payments from underfunded plans. Plans at least 60% but less than 80% funded may only pay lump sums (or other accelerated distributions) up to the lesser of (i) 50% of the present value of the benefit otherwise payable or (ii) the present value of the participant's PBGC maximum guarantee. Plans subject to the restrictions must use the 2025 table for annuity starting dates in 2025, regardless of the plan year.
The present values will increase significantly from 2024 levels due to the increase in the age-65 maximum guaranteed benefit and the decrease in interest rates (August 2024 IRC Section 417(e) lump sum segment rates of 4.50%, 4.96%, and 5.40% vs. the August 2023 rates of 5.45%, 5.52%, and 5.43%) — and to a lesser extent from the update in the Section 417(e) mortality table.
The next table shows the present values for 2025 and the two prior years. Tables of present values dating back to 2008 are available on the PBGC website, along with downloadable Excel tables.

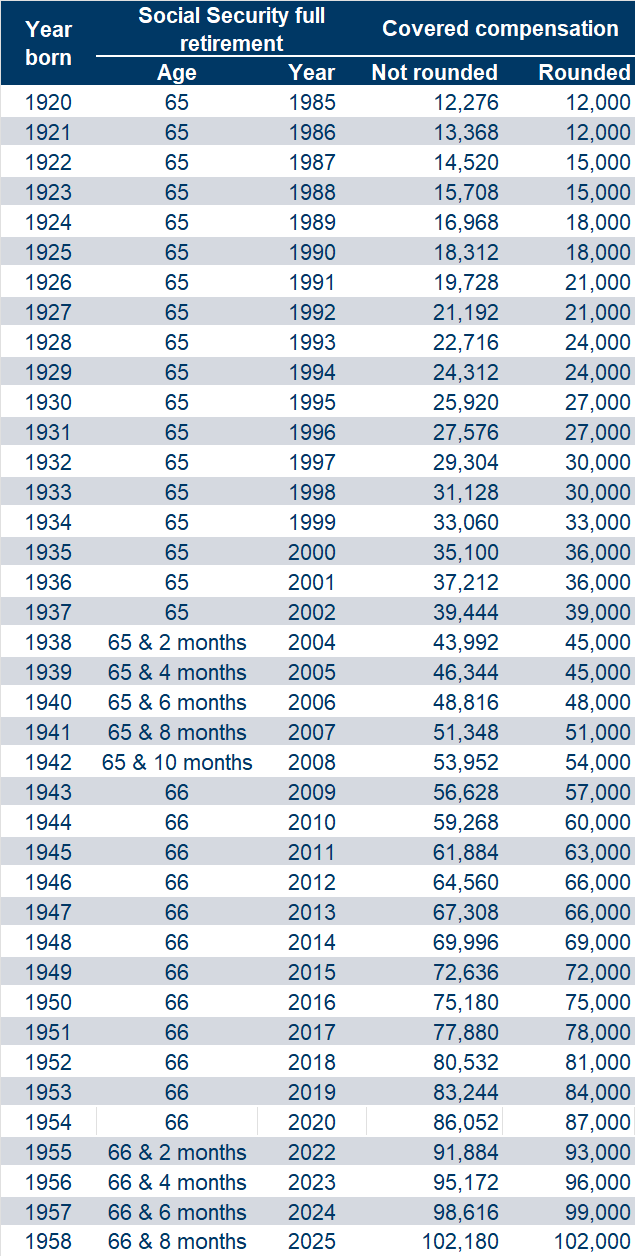
Projected covered compensation
Qualified defined benefit (DB) pension plans use covered compensation to determine “permitted disparity” under Section 401(l) design-based safe harbor rules and “imputed disparity” under Section 401(a)(4) general nondiscrimination testing rules. Covered compensation is the average Old-Age, Survivors and Disability Insurance (OASDI) contribution and benefit base for the 35 years ending with the year the employee reaches Social Security retirement age. Qualified plans have the option to determine permitted or imputed disparity using either actual or rounded covered compensation.
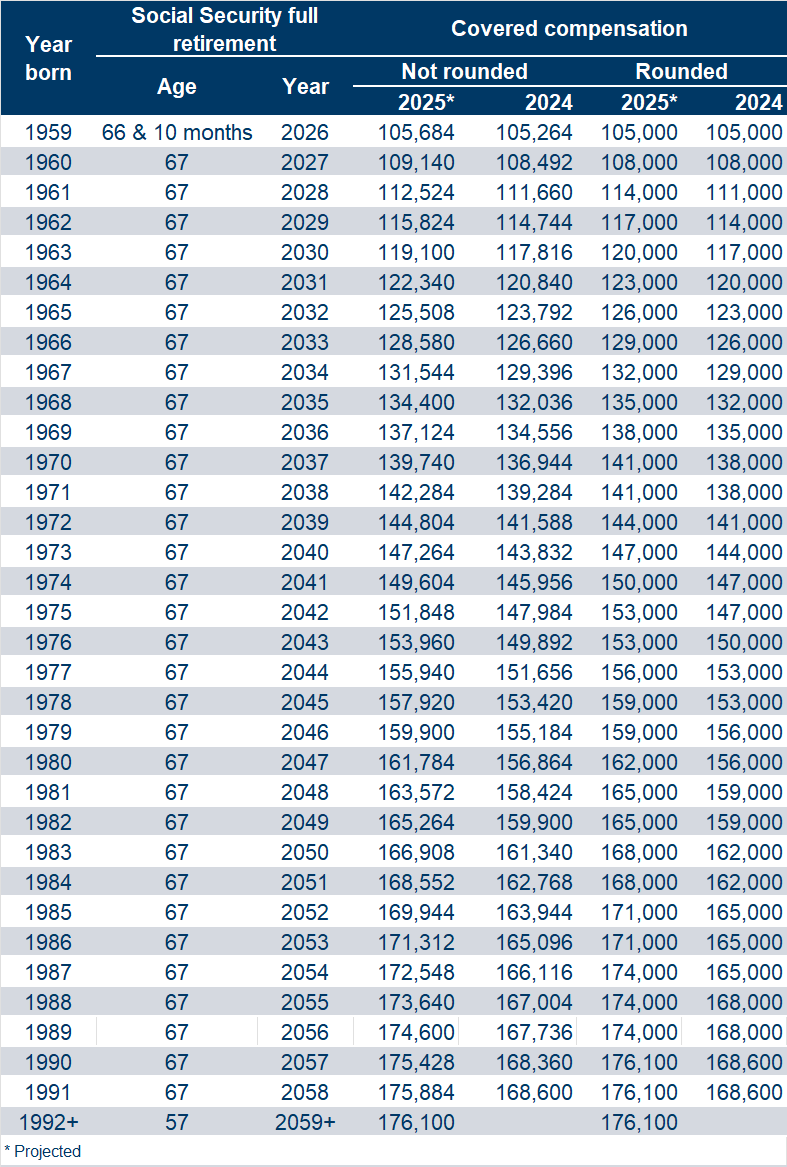
IRS has not yet issued 2025 covered compensation tables, but Mercer has projected these amounts based on the increase in the taxable wage base to $176,100 for 2025 from $168,600 for 2024. The table below shows covered compensation amounts for individuals who have already reached Social Security full retirement age. (At that age, covered compensation becomes fixed and is no longer affected by annual changes in the OASDI contribution and benefit base.)
Related resources
Non-Mercer resources
- Present value of PBGC maximum guarantee (PBGC, Nov. 4, 2024)
- Maximum guaranteed benefit tables (PBGC, Oct. 18, 2024)
- Premium rates for 2025 and earlier years (PBGC, Oct. 11, 2024)
- Press release on Social Security COLA for 2025 (SSA, Oct. 13, 2024)
- Automatic determinations (SSA)